
CURRENT CT CONDITIONS AT-A-GLANCE
STREAMFLOW* IN CT NOW

Click map to go to the data page
RECENT FLOW AT A CT STREAM
7-day data for Bunnell Brook, Burlington, CT
Click map to go to the data page
GROUNDWATER LEVEL
USGS 412825072410501 CT-D 117 Durham, CT
Depth to water level, feet below land surface
Click map to go to the data page
WEATHER FORECAST
Graphic and data courtesy of NOAA
Current watches and warnings, if any in CT
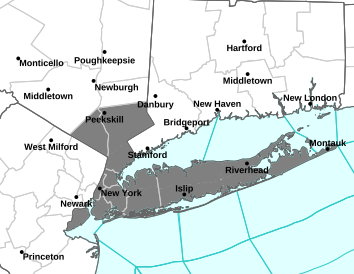
Click map to view weather information
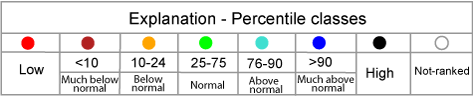
*About ranking flows
Streamflow across the state near the time you loaded or refreshed this page is shown on the Streamflow in CT Now map above. Click on that map to go to the CT USGS streamflow website. The USGS is careful to only rank stream gages with 30 or more years of record on their state map. This is why that map does not show the same number of low and very low rivers as we report here.
We define low streamflow as below the 25th percentile or below 25% of the mean flow for that date, from all stream gages in the data file when rivers are near their lowest points between storms. Very low is under the 10th percentile. We call a flow record-breaking if the flow at the time we recorded it was lower than the lowest daily average flow for that date. That particular flow rate may not set a new record however, unless it stays that way all day because its the average flow over the that whole day that is used to categorize flow rates.
For additional data, see the past 92 days of streamflow graphs from USGS monitoring data (caution: this large dataset may take some time to load). Explore the NEW USGS National Water Dashboard interactive map to access real-time water data from throughout Connecticut.
Why do we count?
The flow between storms is an indicator of long-term stream conditions. Although expansion of a river or stream channel onto its floodplain is a normal, natural occurrence, human interference can cause higher than normal and more frequent flooding. The higher the water level remaining in streams and rivers before a storm, the more likely there will be dangerous conditions, streambed scouring, and other detrimental effects of high water.
When water levels are low, portions of the streambed become too dry to support the aquatic life that usually colonizes those areas. Groundwater seeping from the stream banks can help organisms survive for short times; therefore, well measurements can also be used to identify areas where aquatic life might be in jeopardy.
MORE USEFUL DATA LINKS
- USGS WaterWatch map of 28-day average streamflow compared to historical streamflow
- Today’s USGS stream gage webpage with graphs of flow from every CT gage for the past 30 days compared to their historic daily flows
- A list of all CT stream gages comparing their flow right now to their mean and median flows for today’s date
- Sewage spills in CT reported electronically* in the last 3 days
* This is an experimental map based on information available publicly from a file automatically updated by the GIS staff at the CT Department of Energy and Environmental Protection. Please keep in mind that not all facilities and treatment systems report electronically, and this data has not been verified by either DEEP or Rivers Alliance. Also shown are public water supply watersheds in blue and aquifer protection zones in red.
DROUGHT
The Connecticut Drought Preparedness and Response Plan (“Drought Plan”) provides state and local decision-makers and public water suppliers with a set of formal operating procedures and administrative guidance for proactive drought planning and response. The Drought Plan is designated as a “support plan” within the State Response Framework, Connecticut’s umbrella emergency management operations document.
The State Interagency Drought Workgroup (IDW), consisting of representatives from five state agencies, is responsible for facilitating the planning and response activities of the Drought Plan. Subject matter experts from two federal agencies provide technical assistance to the IDW.
Section V of the Drought Plan identifies the criteria and actions for five stages:
- Stage 1: Below Normal Conditions
- Stage 2: Incipient Drought (formerly Drought Advisory)
- Stage 3: Moderate Drought (formerly Drought Watch)
- Stage 4: Severe Drought (formerly Drought Warning)
- Stage 5: Extreme Drought (formerly Drought Emergency)
U.S. Drought Monitor
The weekly U.S. Drought Monitor uses Tuesday morning conditions to categorize conditions for their weekly report. U.S. Drought Monitor map of northeast
NOAA’s Climate Prediction Center maintains a Drought Outlook map.
Groundwater
Recent data
In Connecticut, the USGS has ten real-time groundwater monitoring wells
The USGS Groundwater Watch website displays data from 58 other wells that are usually measured once a month, comparing the most recent measurements to each well’s measurements taken
in that month in previous years.
Groundwater & streamflow basics
Groundwater levels normally trend downward through the summer and early fall, but if the water table falls well below what is normal for the time of year, baseflow in rivers and streams will be below normal for the time of year also. An inch of heavy rain does not provide as much groundwater recharge as the same total amount of rain over a longer time because much of the heavy rain runs off directly to surface water.
Public Water Supply Information
Your water utility and town are the best sources of information on the status of your water supply. A few systems post their current capacities regularly on their websites, or issue press releases. Rivers Alliance has a partial list of water company websites which is available upon request.
Additionally, The Connecticut Interagency Drought Workgroup meeting handouts contain previous monthly reservoir levels.
Weather Links
Here are links to examples of some of the data available from the National Weather Service (NWS) Advanced Hydrologic Prediction Service (AHPS):
- Precipitation for the last thirty days as a percentage of normal. This is based on a comparison between the precipitation for the last 30 days compared to what would be normal for the last 30 days.
- This month so far as a percentage of normal.
- View precipitation this month so far.
- See what would be normal for this month so far.
Atmospheric rivers are represented in computer modeling by the Center for Western Weather and Water Extremes at the Scripps Institute of Oceanography at the University of California San Diego.
For technical information about past broad-scale weather patterns, see NOAA’s National Centers for Environmental Information State of the Climate Synoptic Discussions. Their discussion for the previous month are usually published about midway through the next month.
Expected Weather
Short range forecasts for Connecticut give precipitation probablilties for 1 week.
Long range computer modeling provides a map of predicted precipitation total for the next two weeks.
The NWS Climate Prediction Center gives prognostications in various time frames.
Flood and Heavy Rain Information
Flood predicting. Go to the Northeast River Forecast Center for flood probabilities at the gaging stations they monitor. Click here for current CT weather watches and warnings, if any.
Paddling. Do not attempt to canoe or kayak on floodwaters; there are usually one or two fatalities per year. Our Connecticut Water Trails website and the webpages of the many paddler groups in the state all have good safety procedures.
Your sewage, your well. When a building is located in a floodplain, floodwaters can saturate and fill a leach field, often flushing out untreated sewage. Floodwater also can flow down into wells, introducing pollutants — such as sewage, soil, bugs, leaves, pesticides such as weed killer and insect poison, and even the dog droppings from the backyard — into the well.
Very important: Any well that was flooded should be pumped and flushed out thoroughly and the system sanitized or “shocked.”
Heavy rainfall alone can cause sewage to get into waterways even if flooding does not happen.
You really do not want to be downstream when raw untreated human sewage is entering the water.
Rivers Alliance thanks Loureiro Engineering Associates, Inc. for their generous sponsorship of the Know Your Flow page.